In the ever-evolving landscape of European real estate, understanding market dynamics has become more nuanced than ever before. Gone are the days when national or even regional data was sufficient to make informed investment decisions.
Today, hyper-localized data—the granular details about specific neighborhoods, streets, and even individual properties—is the key to gaining a competitive edge. But why does this level of precision matter so much, and how can real estate professionals harness its power?
The importance of granularity in real estate
The European real estate market is characterized by its diversity. Each place offers a unique set of opportunities and challenges and national trends, such as rising interest rates or housing shortages, may set the stage, but they often mask the intricacies of local markets.
Hyper-localized data reveals:
1. Micro-Trends in Demand and Supply
While the most sought-after neighbourhoods may experience an overall housing shortage, other areas may face a surplus of high-end apartments but a scarcity of affordable housing. Knowing these nuances allows investors to target their strategies effectively.
2. Neighborhood-Specific Price Fluctuations
A single street in Rome could see property values appreciating rapidly due to a new metro station, while another just a few blocks away stagnates due to noise complaints. Without hyper-local data, these trends remain invisible.
3. Cultural and Demographic Shifts
Understanding the demographic makeup of a neighbourhood—such as the influx of young professionals in certain parts of the city—can help developers and agents position their offerings more strategically.
Benefits for real estate professionals
Hyper-localized data is a powerful tool for various stakeholders in the real estate industry:
- Investors can pinpoint undervalued properties and identify areas with high growth potential.
- Agents and Brokers can better match clients with properties that meet their specific needs and preferences.
- Developers can tailor projects to suit the demands of a specific neighborhood, maximizing profitability.
- Property Managers can optimize rental strategies by understanding local tenant preferences and seasonal trends.
Leveraging technology for hyper-localized insights
Advances in technology have made it easier than ever to collect and analyze hyper-local data. Geographic Information Systems (GIS), big data analytics, and machine learning tools enable professionals to:
- Map property values and rental yields with precision.
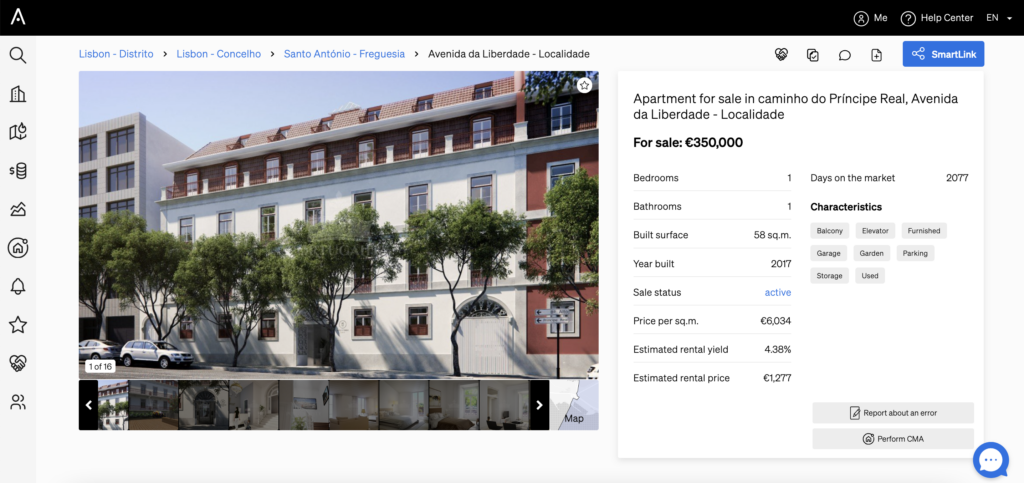
Did you know you can find the Estimated Rental Yield of a property inside CASAFARI’s property page? Investors and their estate agents are able to tailor which properties are good opportunities based on these numbers, selecting only what will add value to a portfolio.
Rental Yield: why is it relevant and how to find it with CASAFARI
- Predict future trends based on historical data.
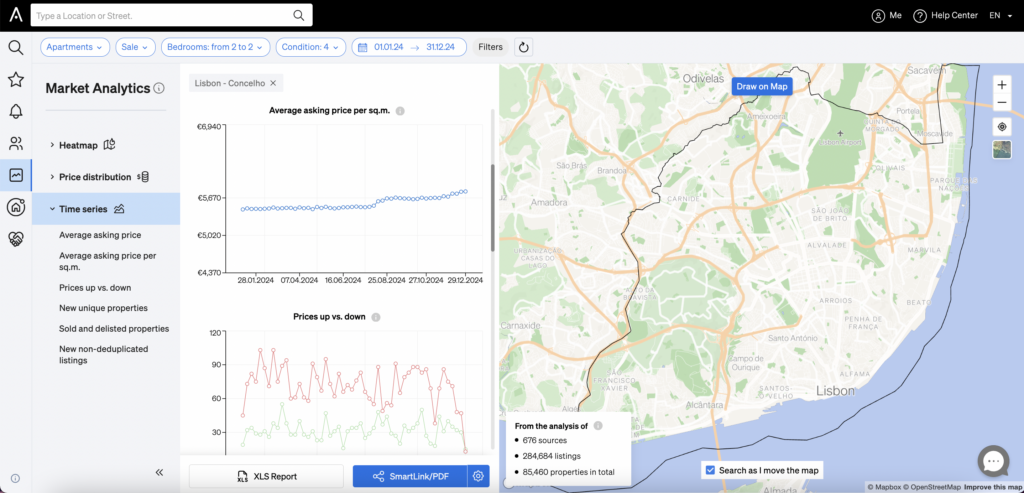
Historical data is a valuable asset for you to be able to understand how the market has been behaving and plan for the future.
Our Market Analytics shows on its Time Series section historical data such as average asking price, average asking price per square metre and amount of prices going up or down, providing an idea of price fluctuations. One can also see the amount of New Unique Properties put on the market, as well as those Sold and Delisted – all this to understand demand and offer dynamics.
Inside the tab Price Distribution, the professional can access information like the total market stock for a certain type of property and the average time spent on the market, which also provides insights about the desirability of a typology or an area.
All this data can be tailored according to different asset types, typologies, prices and characteristics, making sure you have the most accurate analysis at your disposal.
CASAFARI Market Analytics: follow the property market trends
- Identify correlations between factors like school quality, public transportation access, and property demand
Well, that’s easy! Each property page within CASAFARI shows a combo of information that helps real estate professionals make these correlations.
Property Page: all the information of an asset in a single place
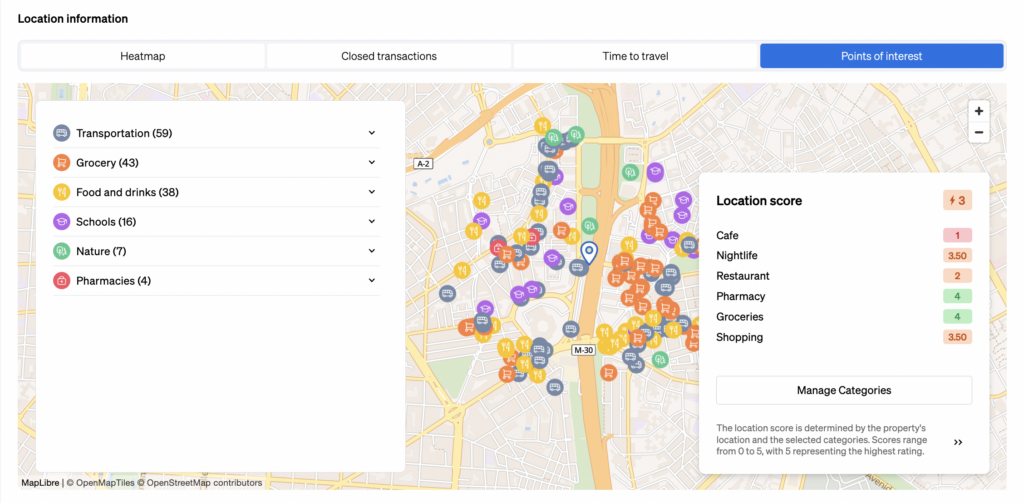
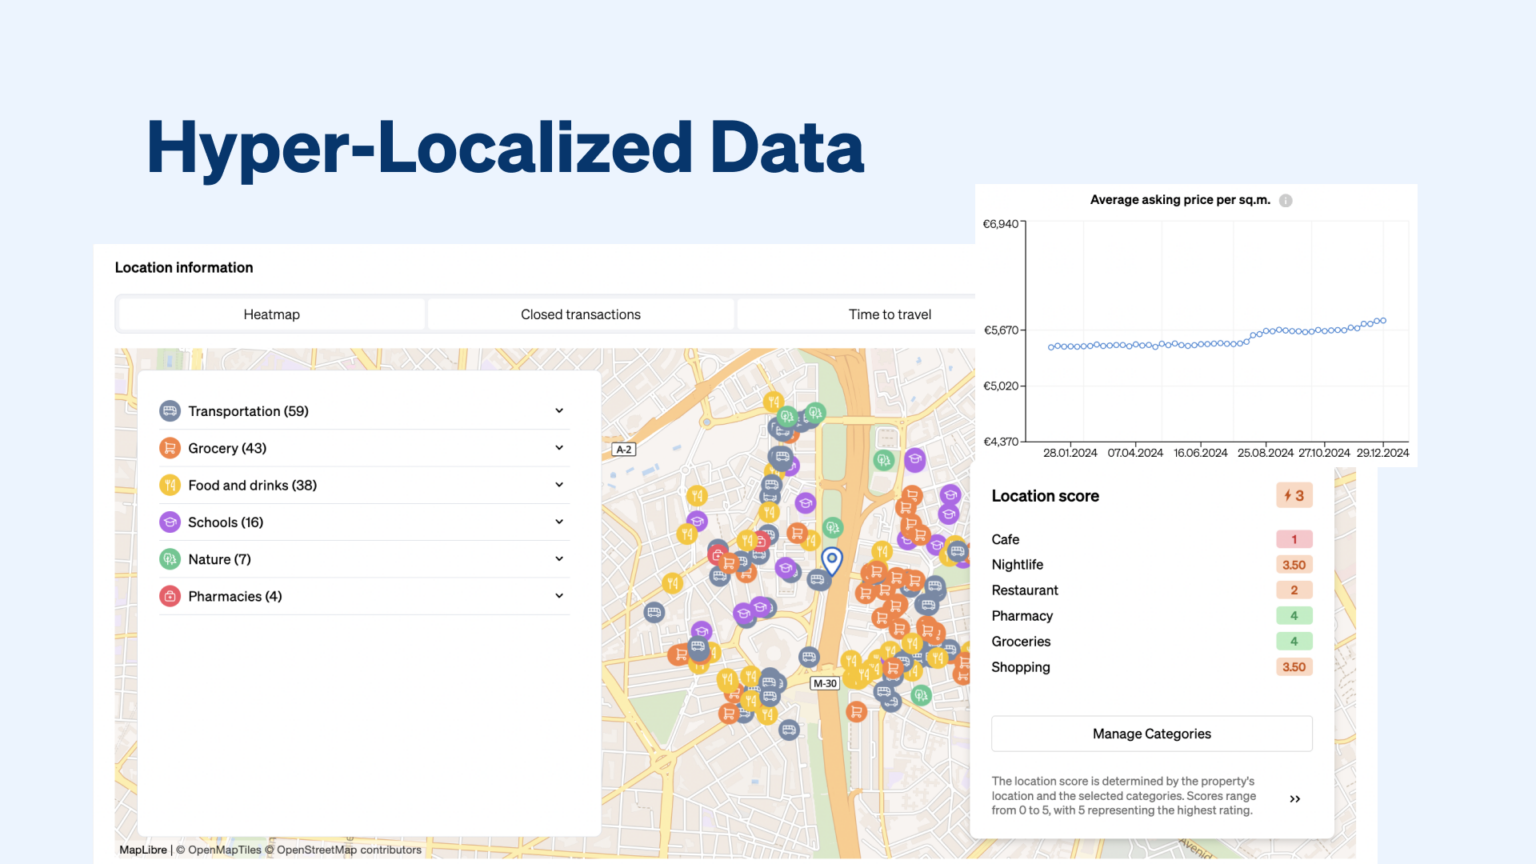
On the Points of Interest tab, you can find where are the Transportation Options, Foods & Drinks, Schools, Groceries and many other amenities in the vicinity of a property. It’s also shown a location score that analyses how interesting this property is regarding each of these categories.
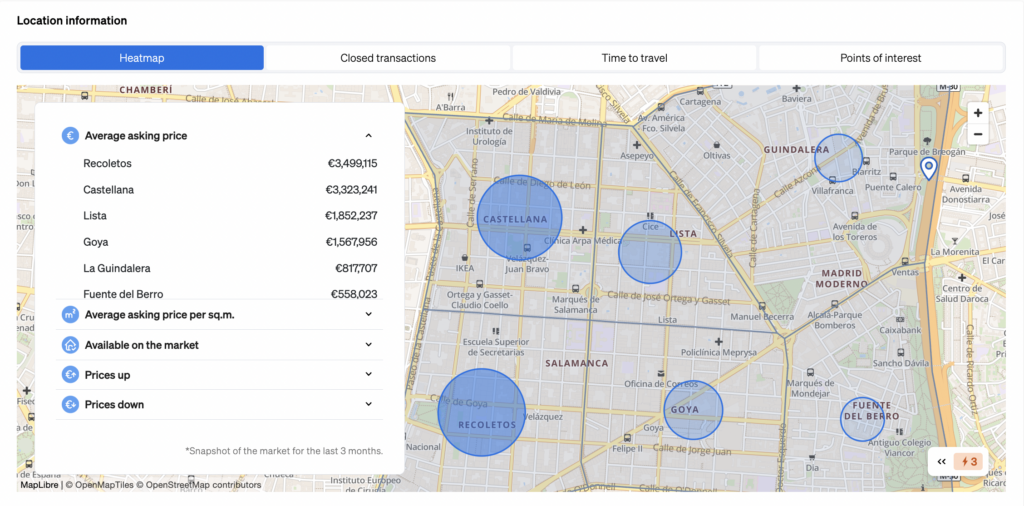
You can also see on the Heatmap tab information about the market stock, average asking prices and price changes, to compare the most expensive and sought-after areas of the neighbourhood with those with the best amenities.
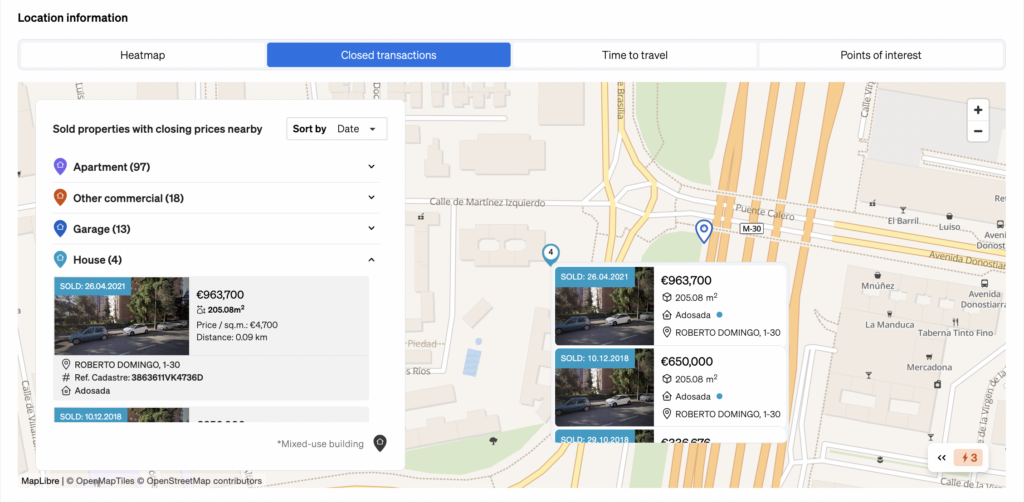
At the same time, on the tab Closed Transactions you can find the demand for apartments, houses, garages and commercial properties in the same area. You can see when the properties were sold, where they are and for how much they were purchased.
Location Intelligence Widget: enhanced property listings on your website
In a competitive and diverse market like European real estate, hyper-localized data is not just a luxury; it’s a necessity. By delving deep into the specifics of local markets, professionals can uncover opportunities that broader analyses overlook.
As technology continues to evolve, the ability to harness and act upon these insights will increasingly define success in the industry.
