A hotspot refers to a location that is rapidly gaining popularity and experiencing significant growth in property value, rental demand, or overall market activity. These areas often attract both investors and homebuyers looking to capitalize on emerging trends before prices peak.
And, in the world of real estate, quickly identifying the next “hotspot” can mean the difference between an average investment and a highly profitable one. Traditionally, recognizing these rising neighborhoods required a mix of intuition, local knowledge, and luck. But as the market becomes increasingly competitive and complex, relying on gut feelings is no longer enough.
Today, data-driven insights are transforming how professionals evaluate and identify promising areas. From historical price trends to buyer behavior and infrastructure developments, data provides a more accurate and comprehensive view of where opportunities are forming.
In this article, we’ll explore how data empowers industry players to uncover hidden gems, make smarter investment decisions, and stay ahead of the curve.
1. Understanding Market Trends Through Data
Data plays a crucial role in revealing how a neighborhood is evolving and whether it’s on the cusp of becoming a high-demand area. Rather than relying on unreliable evidence or slow-moving reports, professionals now turn to real-time, historical, and comparative data to understand where the market is heading.
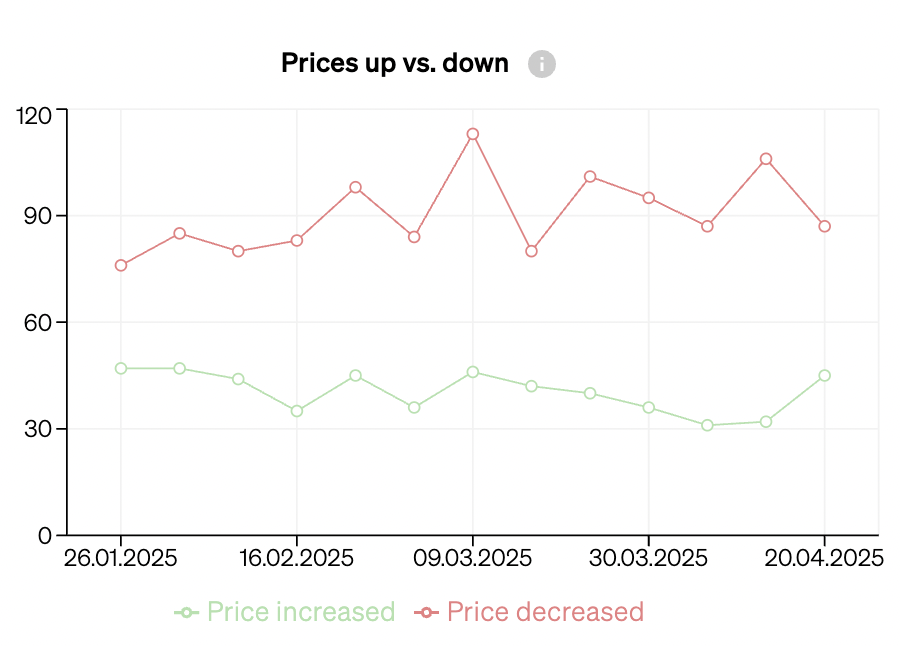
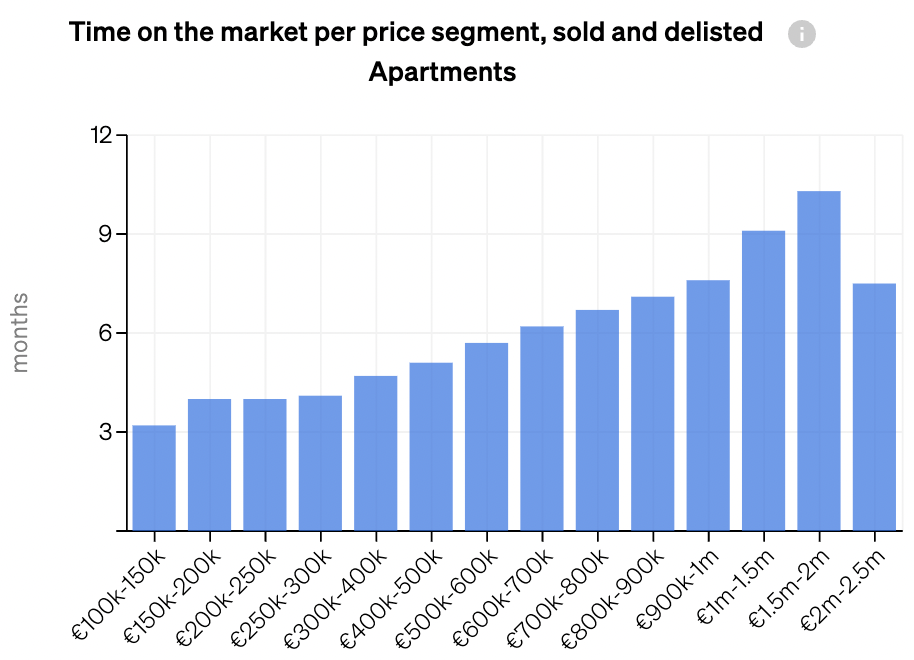
One of the most telling indicators is historical price data. By analyzing how property prices have changed over time in a particular location, professionals can detect patterns of steady growth, volatility, or sudden spikes. You can see how it’s done in the example below, from CASAFARI’s Market Analytics tool.
CASAFARI Market Analytics: follow the property market trends
A consistent upward trajectory in property values may signal a neighborhood that is gaining in popularity, possibly due to improved infrastructure, new amenities, or shifts in demographics.
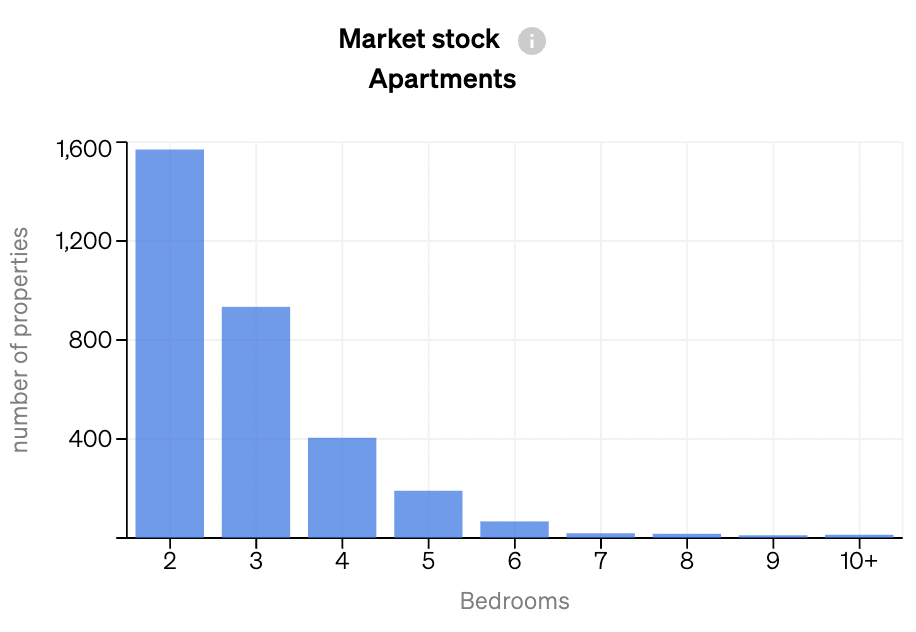
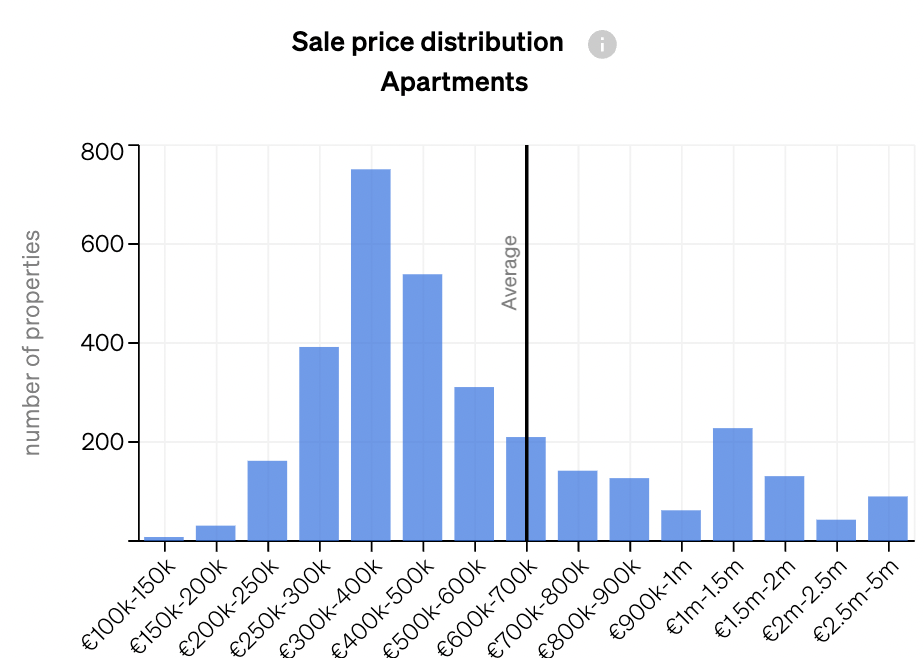
Another key factor is tracking supply and demand dynamics. Data on the number of listings versus the number of transactions or inquiries can provide insights into how competitive a market is, like on these charts from our Market Analytics.
A low supply combined with high demand often indicates a seller’s market—an environment typically associated with hotspots. Monitoring absorption rates (how quickly properties sell or rent) can further confirm whether an area is heating up or cooling down.
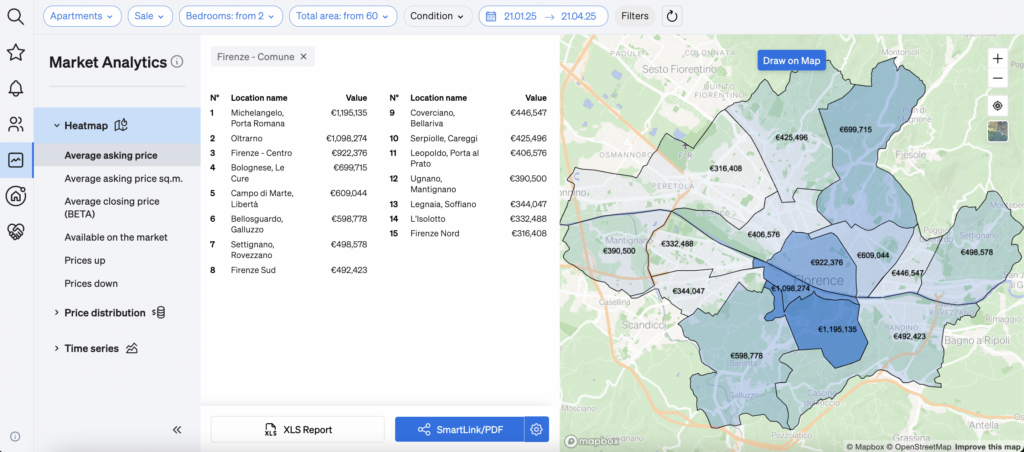
Visualization tools such as heatmaps are also invaluable for spotting trends at a glance. These visual layers from Market Analytics highlight market trends across different neighborhoods, helping stakeholders to easily identify clusters of activity or potential growth corridors.
2. Market inventory and supply data: unlocking opportunities in the gaps
Understanding how much housing stock is available, how quickly it moves, and whether it aligns with market demand provides critical insights into where opportunities lie—and where competition may soon intensify.
Recognizing areas with limited supply but growing interest
When demand outpaces supply, prices tend to rise. By identifying neighborhoods with limited housing inventory but increasing interest, real estate professionals can pinpoint areas on the verge of significant value growth.
Comparing inventory levels to market absorption rates
Equally important is comparing current inventory levels with market absorption rates, which measure how quickly available properties are being sold or rented. A low inventory combined with a high absorption rate typically indicates a strong market, where demand is not only present but active.
These conditions often precede price increases and can serve as early indicators of a neighborhood transitioning into a hotspot.
Spotting gaps in housing types or price brackets
Inventory data also exposes mismatches between what’s available and what buyers or renters are looking for. For instance, a neighborhood might have an abundance of high-end apartments but a lack of mid-range family homes or studio flats.
Identifying these gaps in housing types or pricing brackets opens the door for targeted development or investment strategies that meet underserved demand segments, especially in emerging districts.
Detecting seasonal fluctuations and long-term demand trends
Finally, examining seasonal inventory patterns and their correlation with demand trends adds depth to the analysis. By layering longitudinal data—tracking performance over months and years—professionals can distinguish between short-term noise and meaningful long-term trends, allowing for more confident, data-backed decisions.
3. Evaluating infrastructure and development plans
Real estate hotspots don’t just happen—they’re often shaped by infrastructure and urban development initiatives. Whether it’s a new metro line, a university campus, or a retail complex, infrastructure projects can drastically enhance a neighborhood’s desirability and long-term value.
The impact of public infrastructure investments
Public infrastructure investments are among the most powerful catalysts for real estate growth. New or improved transportation systems—such as subways, light rail, highways, or bike lanes—significantly reduce commute times and improve connectivity. For prospective buyers or tenants, this increased convenience can turn previously overlooked areas into highly attractive alternatives to saturated neighbourhoods.
Data on planned or ongoing infrastructure projects can provide early signals of where demand is likely to shift next, so keeping an eye out for the news about changes in areas that you work with is part of the real estate professional’s tasks.
Commercial and institutional anchors as value drivers
Developments such as tech parks, hospitals, or universities, often act as long-term anchors for real estate demand. These projects attract not only a workforce but also a supporting ecosystem of housing, retail, and services. Mapping out where these amenities are or will expand to can point to markets with sustained growth potential.
With CASAFARI’s Location Intelligence Widget, you can check what’s interesting in the surrounding areas of any property, making sure to understand what has been attracting the buyers’ interest to a hotspot.
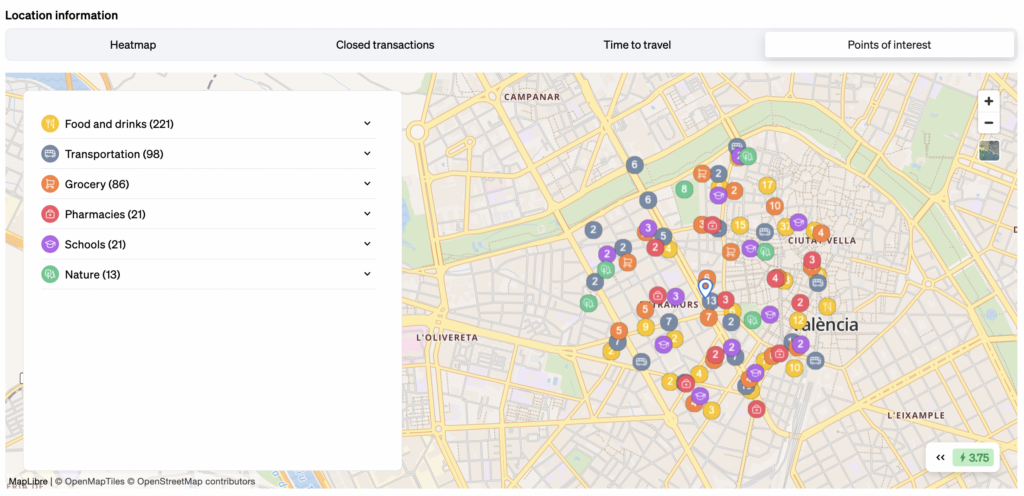
Location Intelligence Widget: enhanced property listings on your website
4. Competitive and Investment Intelligence
Tracking developer, investor and competitors activities
Competitive and investment intelligence refers to the strategic use of data to monitor the actions of developers, investors, and other market players. By identifying where stakeholders like developers and investors are allocating resources, real estate professionals can gain critical insight into where they anticipate future demand and price appreciation.
The same goes for taking a look at the numbers from the market: comparing an area’s average listing time, pricing strategy, and rental yields to other districts helps identify outperforming regions. If a particular neighborhood is consistently delivering higher returns or lower vacancy rates than surrounding areas, it may indicate untapped value or emerging popularity.
With CASAFARI, you can activate notifications to see the new properties your competitors are adding to their portfolio and where they are. Also, you can also request both a customized Benchmarking report, to better understand the advances of other agencies, and a Properties report, to see the rental yields, vacancy rates and other relevant KPIs.
Monitor your competitors with CASAFARI: get to know Alerts
CASAFARI’s Market Reports: the way to data-driven decisions
Evaluating yield expectations
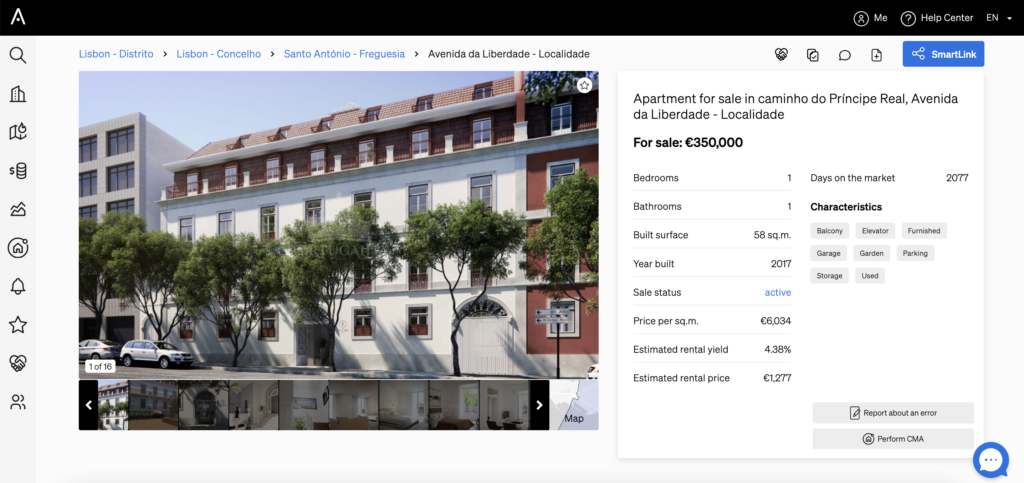
With rental yield analytics provide a lens into the financial performance of different markets. High, stable yields in a previously overlooked neighborhood can point to rising rental demand—and possibly, a new hotspot in the making!
Did you know you can check the rental yields of properties inside of CASAFARI’s platform? And to map a full segment of the market, you can even request a personalised Market Report showing you how rental yields are working for an asset class throughout the city, for example.
Rental Yield: why is it relevant and how to find it with CASAFARI
There’s no denying that the ability to identify real estate hotspots has become a strategic advantage—and data is the compass guiding professionals toward the most promising opportunities.
Whether it’s looking at market trends or shifts in buyer and renter behavior, data provides the clarity needed to allow a shift from reactive to proactive decision-making. The real estate professionals who invest in understanding and applying this information will be the ones who not only spot the next hotspot—but help define it.